Quarterly Portfolio Manager Commentary
June 30, 2024

Cash Management Portfolios
What market conditions had a direct impact on the bond market this quarter?
Economic Activity – The lagged effects of Federal Reserve (Fed) monetary policy tightening appear to be having a greater impact on U.S. economic activity. Inflation pressures eased throughout the second quarter (Q2) while spending slowed and employment conditions came into better balance, precisely what the Fed has been looking for. Q2 U.S. Gross Domestic Product (GDP) growth is projected to be near 1.5% to 2.0% amid slower consumer spending and private investment. Personal consumption decelerated throughout Q2 as consumers continue to pull back on discretionary spending amid elevated prices and high interest rates. May U.S. job openings declined to 8.1 million open positions compared to 8.4 million at the end of Q1, while total unemployed workers in the labor force as of June rose to 6.8 million, reflecting strong immigration and a higher participation rate. Monthly Non-farm Payrolls (NFP) growth decelerated to an average of 177,000 during Q2, nearly 100,000 below Q1’s pace, and the U3 Unemployment Rate climbed to 4.1% in June. Average Hourly Earnings growth is off its highs but remains elevated at 3.9% year-over-year (YoY), emphasizing still-solid labor demand. The Consumer Price Index (CPI) eased to 3.3% in May versus 3.5% in March, suggesting inflation’s reacceleration to start the year was not a trend. Core inflation continued its gradual downward trend with CPI ex. food and energy rising 3.4% YoY for May compared to 3.8% YoY in March. The Fed’s preferred inflation index – the PCE Core Deflator Index – increased 2.6% YoY for May. While recent inflation data has been encouraging, sustained inflation near the Fed’s 2% target will require below-trend growth and further loosening in the labor market, running counter to the Fed’s “goldilocks” projections and raising concerns the Fed will need to orchestrate a broader economic slowdown to get inflation back to target.
Monetary Policy – As markets expected, the Fed kept its federal funds target range unchanged at 5.25% to 5.50% at the May 1 and June 12 meetings, with minimal changes made to the Fed’s post-meeting statement’s characterization of the economy. Fed officials noted “modest progress” has been made toward their 2% inflation target, but greater confidence inflation is moving sustainably toward target is needed before reducing policy rates. In June, the Fed began slowing its balance sheet reduction program (quantitative tightening) by reducing the monthly cap on Treasury securities from $60 billion to $25 billion. The Fed is maintaining the $35 billion cap on agency mortgage-backed securities.
The Federal Open Market Committee (FOMC) released its updated Summary of Economic Projections at the June meeting which showed a slightly higher core inflation forecast than the prior release and unchanged unemployment rate and GDP growth forecasts. Revisions to economic assumptions in 2025 and 2026 were minimal. The median projection for the federal funds rate at the end of 2024 was revised to a range of 5.0% to 5.25%, now showing 25 basis points (bps) of rate cuts this year compared to 75 bps in the March projections. The median dot now shows 100 bps of cuts in both 2025 and 2026 (versus 75 bps each in the March projections), keeping cumulative cuts through 2026 unchanged. The economic projections continue to reflect a best-case scenario, implying inflation can decline toward the Fed’s 2% target without a slowdown in growth or deterioration in unemployment. Currently, growth is above long-term potential and employment demand continues to be strong and is not likely to slow to a point where prices would begin to decline (i.e. inflation falling). We believe for inflation to decline back to 2% we will either need a period of below-potential growth or higher unemployment. It is difficult to see inflation fall back to target without one or both of these things happening.
Fiscal Policy – After narrowly avoiding a government shutdown in March, fiscal policy action was quiet in Q2 and is expected to remain muted over the coming months as Washington D.C.’s focus fully shifts to the upcoming elections. Policy action will intensify later this year as the Biden administration and Congress will need to contend with passing a budget for fiscal year 2025 (starts October 2024), but we suspect a series of continuing resolutions will be used to get through the November elections. Additionally, the U.S. government debt ceiling will be reinstated January 1, 2025, with the Treasury expected to use extraordinary measures to push the deadline into summer 2025, allowing Congress further time to reach a deal.
Looking further out, the Infrastructure and Jobs Act (2021) and Inflation Reduction Act (2022) will boost government spending over the long-term, but near-term impacts are likely to be minor. On the municipal side, state and local government finances are starting to diverge with municipal entities more dependent on sales and property taxes faring better than those dependent on income taxes, but strong reserves have left the overall sector in a solid position should economic conditions weaken further.
Credit Markets – U.S. Treasury yield curve steepened in the quarter as continued better-than-expected economic growth pushed out the start of anticipated 2024 Fed rate cuts. Credit spreads were essentially unchanged in the quarter as strong demand for yield and spread product kept pace with corporate supply. Credit spreads are tight on a historical basis as financial conditions remain accommodative. Elevated index yields provide a cushion against the negative price action of higher rates, with credit sensitive and short treasury indexes posting overall positive returns for the quarter despite higher long-term rates.
Yield Curve Shift
|
U.S. Treasury Curve |
Yield Curve 3/31/2024 |
Yield Curve 6/30/2024 |
Change (bps) |
|---|---|---|---|
|
3 Month |
5.362% |
5.355% |
-0.7 |
|
1 Year |
5.024% |
5.110% |
8.6 |
|
2 Year |
4.620% |
4.753% |
13.3 |
|
3 Year |
4.409% |
4.550% |
14.1 |
|
5 Year |
4.212% |
4.377% |
16.4 |
|
10 Year |
4.200% |
4.396% |
19.6 |
Duration Relative Performance

*Duration estimate is as of 6/30/2024
The three-month to five-year portion of the yield curve steepened 17.7 bps in the quarter as longer-end yields rose as Fed rate cut expectations were pushed out. There was a fair amount of yield volatility intra-month, with two-year yields peaking over 5.00% in late April, which provided an opportunity for portfolios to extend duration and lock in yields. The steepening yield curve benefitted portfolios with a shorter duration and a more bulleted structure with higher exposure to front-end positioning.
Credit Spread Changes
|
ICE BofA Index |
OAS* (bps) 3/31/2024 |
OAS* (bps) 6/30/2024 |
Change (bps) |
|---|---|---|---|
|
1-3 Year U.S. Agency Index |
9 |
5 |
-4 |
|
1-3 Year AAA U.S. Corporate and Yankees |
10 |
10 |
0 |
|
1-3 Year AA U.S. Corporate and Yankees |
29 |
31 |
2 |
|
1-3 Year A U.S. Corporate and Yankees |
55 |
56 |
1 |
|
1-3 Year BBB U.S. Corporate and Yankees |
85 |
82 |
-3 |
|
0-3 Year AAA U.S. Fixed-Rate ABS |
55 |
55 |
0 |
Option-Adjusted Spread (OAS) measures the spread of a fixed-income instrument against the risk-free rate of return. U.S. Treasury securities generally represent the risk-free rate.
For the most part, credit spreads were unchanged in the second quarter. Credit spreads on a historical basis are relatively tight, which allows little room for further improvement from current levels. Credit spreads in the investment-grade sector have benefitted from continued solid growth and generally accommodative financial conditions. AAA-rated ABS spreads and single-A U.S. corporate debt ended the quarter with almost identical OAS spreads.
Credit Sector Relative Performance of ICE BofA Indexes
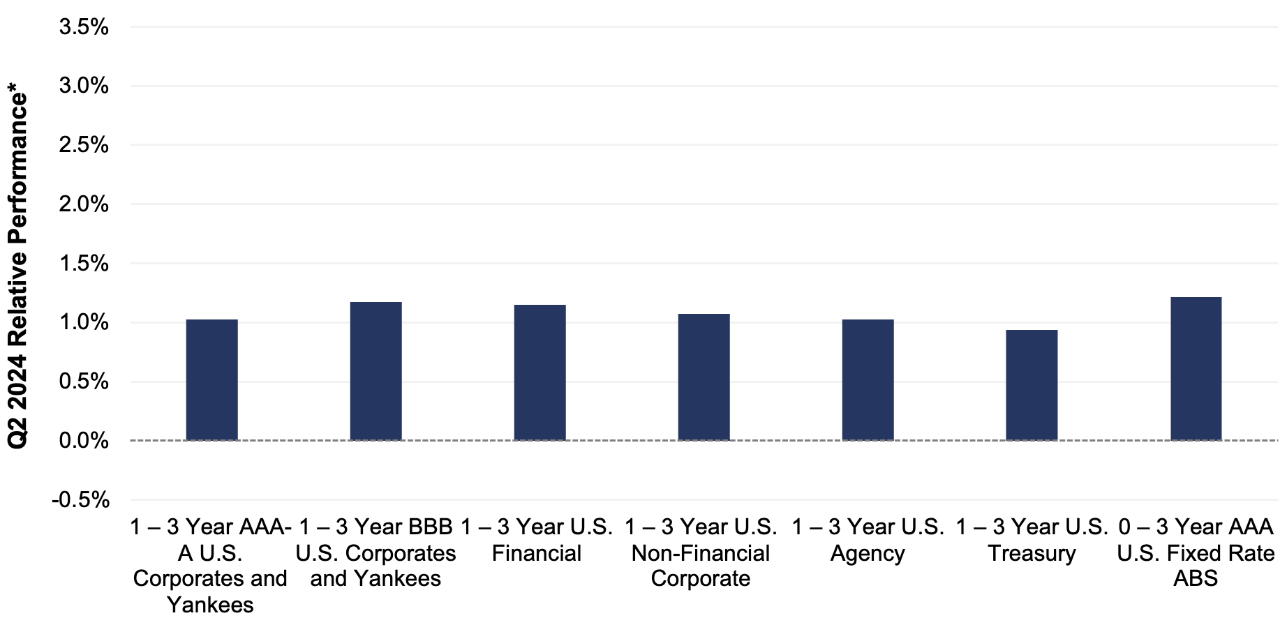
ICE BofA Index
*AAA-A Corporate index outperformed the Treasury index by 8.7 bps.
*AAA-A Corporate index underperformed the BBB Corporate index by 14.9 bps
*U.S. Financials outperformed U.S. Non-Financials by 7.6 bps
U.S. financials outperformed non-financial corporate debt primarily due to its higher coupon advantage, as spreads for both sectors remained roughly unchanged. BBB credit outperformed AAA-A credit as demand for spread product and corporate debt remained strong in the quarter.
What were the major factors influencing money market funds this quarter?
The second quarter of 2024 continued with the FOMC on hold and the market taking a moderately dovish tone as economic and employment data and inflation gauges softened on the margin. The Fed left rates unchanged at a range of 5.25% to 5.50% at the June 12 meeting and indicated they now anticipate one 25 bps cut by year-end. Fed fund futures are a bit more dovish, forecasting 50 bps in rate cuts in 2024. There are a wide range of opinions on the timing of future rate activity, and the challenge for managers going forward is determining how the economy and inflation will influence FOMC action.
Money market fund assets continued to increase during the quarter as elevated money market yields attracted investors. With the Fed focused on price stability, money market funds remain an attractive investment option for fixed income investors.
First American Prime Obligations Funds
Credit conditions and trading ranges appear stable given the current rate environment. Given the yield curve and our conservative cash flow approach, the First American Funds were positioned with strong portfolio liquidity metrics influenced by Fund shareholder makeup. We continued to employ a heightened credit outlook, maintaining positions presenting minimal credit risk to the Fund’s investors. During the second quarter, our main investment objective was to maintain liquidity while opportunistically enhancing portfolio yield based on our economic, credit and interest rate outlook, along with considerations of investor cash flows. We believe the credit environment and higher relative fund yields make the sector an appropriate short-term option for investors.
First American Government and Treasury Funds
Treasury bill/note/dealer repo supply expanded as the Fed continued quantitative tightening and overall debt needs increased. Front-end Treasuries provided a marginal yield pick-up, providing government and treasury money market funds with a repo substitute. With the Fed on hold and their next move most likely a downward move in rates, managers extended durations, investing in longer-term securities to get ahead of a forecasted lower yield environment. The extension into lower yielding long-term securities has put marginal downward pressure on portfolio yields. When presented with appropriate value, we also purchased floating-rate investments designed to benefit shareholders over the securities holding period. Our investment strategy will be fluid in the coming quarters as markets make determinations on the Fed’s comfort level with inflation and, ultimately, the timing and pace of future rate moves.
First American Retail Tax Free Obligations Fund
Tax-exempt money market fund industry-wide assets continued to trend upward, reaching a nearly five-year high of more than $130 billion in early June. Resets on variable rate demand notes (VRDNs) were approximately 30 bps higher on average versus Q1. The Securities Industry and Financial Markets Association (SIFMA) index spiked above 4% multiple times, as broker/dealers reacted to various events, including tax season and quarter end. Municipal notes with one-year maturities saw yields rise by about 15 bps, primarily due to diminished expectations for Federal Reserve easing. Portfolio management continues to be focused on positioning the Fund with higher allocations to fixed rate securities and a longer weighted average maturity (WAM) versus its peers. This strategy reflects our expectations that heavy reinvestment from municipal bond and coupon payments may likely drive VRDN resets lower over the coming months. Further, we consider the yield costs of protecting against economic weakness as relatively low, and we believe the Fed reaction function is now more tilted to those type of easing scenarios.
What near-term considerations will affect fund management?
Industry-wide, prime fund yields have probably peaked and will gradually fall as managers roll maturities into flat to lower-yielding securities that are pricing in the possibility of future rate cuts. Compression in credit spreads will also narrow SOFR floating rate coupons putting marginal downward pressure on portfolio yields. However, broadly speaking, front-end yields in credit securities should continue to benefit from the overall supply increase in Treasury securities, as well as the reduced demand from impending money market fund reform, creating competition among credit issuers for the marginal dollar. However, we believe that the Institutional Prime Money Market class is small enough that the overall impact will be muted. Based on our market outlook and breakeven analysis, in the coming quarters we will seek to capitalize on investment opportunities that make economic sense. We believe the Institutional and Retail Prime Obligations Funds will remain reasonable short-term investment options for investors seeking higher yields on cash positions while assuming minimal credit risk.
Yields in the government-sponsored enterprise (GSE) and Treasury space will remain influenced by Fed policy and Treasury bill/note supply. With front-end yields elevated and the Fed still wary of inflation, the investment environment for government money market funds should remain attractive. As with non-government debt, government and Treasury fund yields have probably peaked and will continue to gradually decline as managers roll maturities into securities with lower yields that are pricing in future rate reductions. We anticipate some moderate yield dislocations in Treasury and GSE issues as the influx of bill supply and continued quantitative tightening increase competition as bonds look for a home away from dealer balance sheets. Any large supply changes in Treasury issuance may create yield volatility on the front-end as the forces of supply and demand seek optimization. Investors may also decide to opportunistically invest in term securities, extending durations, as markets attempt to solve the timing and pace of future Fed policy. We will continue to seek value in all asset classes and exploit market conditions that support domestic and global economic outlooks.
For more information about the portfolio holdings, please visit
https://www.firstamericanfunds.com/index/FundPerformance/PortfolioHoldings.html
Sources
Bloomberg
https://about.bgov.com/brief/the-presidents-fy25-budget-request/
https://www.federalreserve.gov/monetarypolicy/files/monetary20240501a1.pdf
https://www.federalreserve.gov/monetarypolicy/files/monetary20240612a1.pdf
https://www.federalreserve.gov/monetarypolicy/files/fomcprojtabl20240612.pdf

Jim Palmer, CFA

Jeff Plotnik

Mike Welle, CFA