Quarterly Portfolio Manager Commentary
December 31, 2023

Cash Management Portfolios
What market conditions had a direct impact on the bond market this quarter?
Economic Activity – Amid expectations for a sharp slowdown in growth, U.S. economic activity remained resilient, with fourth quarter (Q4) U.S. Gross Domestic Product (GDP) growth projected near 1.5% for the quarter. Personal consumption slowed throughout Q4 but stayed positive as U.S. households continue to benefit from moderating price pressures and solid job and income gains. The labor market continues its gradual rebalance with November U.S. job openings declining to 8.8 million open positions compared to 9.4 million at the end of Q3. Total unemployed workers in the labor force as of year-end was stable at 6.3 million. Monthly Non-farm Payrolls (NFP) growth further moderated, averaging 165,000 during Q4 with the U3 Unemployment Rate at 3.7% in December. Growth in Average Hourly Earnings is off its highs but still elevated at 4.1% year-over-year (YoY), emphasizing labor demand remains firm despite recent signs of easing. Headline inflation readings were lower on the quarter, reflecting declines in energy prices, with the Consumer Price Index (CPI) at 3.4% in December versus 3.7% in September. Core inflation continued its gradual downward trend with CPI ex. food and energy rising 3.9% YoY for December compared to 4.1% YoY in September. The Federal Reserve’s (Fed's) preferred inflation index – the PCE Core Deflator Index – increased 3.2% YoY for November. The recent trend of subdued inflation is promising and suggests price stability is within reach, but achieving sustainable 2% inflation will require further cooling of services prices.
Monetary Policy – The Fed elected to keep its target range for the federal funds rate unchanged at 5.25% to 5.50% at both the November 1 and December 13 meetings, as they continue to monitor incoming economic data and assess lagged impacts of prior rate increases. Maintaining the target range throughout the quarter was fully anticipated by the market, but the December meeting statement and press conference were viewed as dovish, with the Fed acknowledging progress on lowering inflation and noting rates are well into restrictive territory. The change in language signifies a policy pivot from the Fed’s prior restrictive stance and confirms the hiking cycle is complete. Despite this change, the Fed continued to implement its balance sheet reduction program (quantitative tightening (QT)), with a monthly cap of $60 billion in Treasury securities and $35 billion of agency mortgage-backed securities.
The Federal Open Market Committee (FOMC) released its updated Summary of Economic Projections at the December meeting. Revisions were modest; however, the most notable change was the median projection for the federal funds rate at the end of 2024, which was revised to a range of 4.5% to 4.75% compared to 5.0% to 5.25% following the September meeting.
The median dot now reflects 75 basis points (bps) of rate cuts in 2024 and 100 bps in 2025. The longer run dot was unchanged at 2.5%. The economic projections continue to suggest a growing consensus among the FOMC for an economic soft-landing and reflect a best-case scenario, implying inflation can decline toward the Fed’s 2% target without a meaningful slowdown in growth or deterioration in unemployment.
Fiscal Policy – Following a year in which fiscal spending was additive to U.S. GDP, recent legislative actions suggest government spending will have a modest dampening effect on economic growth in 2024. The debt ceiling agreement in mid-2023 keeps nondefense discretionary spending flat in 2024 while capping growth at 1% in 2025. With defense spending set to increase about 3% in 2024, these levels imply a reduction in real spending over the next two years. Further, Congress narrowly averted a government shutdown in November by passing a continuing resolution that extended government funding at current levels into the first quarter of 2024. While a recent agreement on overall discretionary spending levels consistent with the prior debt ceiling agreement provides hope for avoiding a shutdown, reaching a long-term funding deal remains challenging as congressional Republicans have voiced demands for further spending cuts this year.
Looking beyond the immediate concerns, the Infrastructure and Jobs Act (2021) and Inflation Reduction Act (2022) will boost government spending over the long-term, but near-term impacts are likely to be minor. On the municipal side, state and local government finances are starting to diverge with municipal entities more dependent on sales and property taxes faring better than those dependent on income taxes, but strong reserves have left the overall sector in a solid position if economic conditions weaken further.
Credit Markets – Yield curve levels plunged on market perception that the Fed has pivoted from higher-for-longer polices to 2024 rate cuts. Intra-month rate moves were even more severe than end-of-quarter point-to-point measures, with two-year yields ending the year almost 100 bps below the October 18 high of 5.224%. Despite QT and Fed policy rates reaching what are likely to be their peak for this cycle, financial conditions have eased considerably, reflected by December Bloomberg U.S. Financial Conditions Index readings indicating greater accommodation than at any point since the Fed started raising rates in March 2022. Elevated index yields to start the quarter combined with price appreciation from lower U.S. Treasury yields and tighter credit spreads to generate strong fixed income returns across all sectors. The bulk of these returns were concentrated in November and December.
Yield Curve Shift
|
U.S. Treasury Curve |
Yield Curve 9/30/2023 |
Yield Curve 12/31/2023 |
Change (bps) |
|---|---|---|---|
|
3 Month |
5.446% |
5.332% |
-11.4 |
|
1 Year |
5.448% |
4.762% |
-68.6 |
|
2 Year |
5.044% |
4.250% |
-79.4 |
|
3 Year |
4.799% |
4.009% |
-79.0 |
|
5 Year |
4.609% |
3.847% |
-76.2 |
|
10 Year |
4.571% |
3.879% |
-69.2 |
Duration Relative Performance
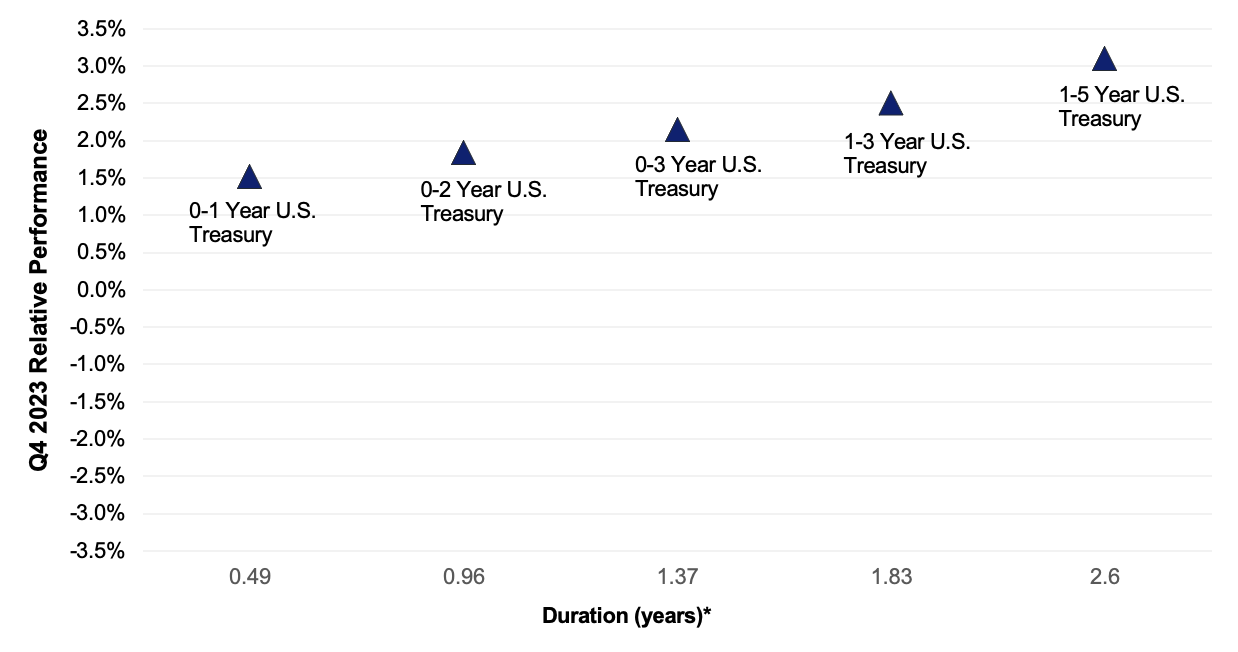
*Duration estimate is as of 12/31/2023
The significant fall in yield curve levels drove strong absolute returns for U.S. Treasuries with longer-duration Treasury indexes benefitting more than their shorter-duration peers. The three-month to five-year portion of the yield curve reversed recent trends and inverted 64.8 bps in the quarter. Increased U.S. Treasury issuance is beginning to strain markets, with most Treasury auctions seeing tepid demand compared to previous quarters and repo financing rates rising toward year-end.
Credit Spread Changes
|
ICE BofA Index |
OAS* (bps) 9/30/2023 |
OAS* (bps) 12/31/2023 |
Change (bps) |
|---|---|---|---|
|
1-3 Year U.S. Agency Index |
21 |
10 |
-11 |
|
1-3 Year AAA U.S. Corporate and Yankees |
16 |
10 |
-6 |
|
1-3 Year AA U.S. Corporate and Yankees |
40 |
34 |
-6 |
|
1-3 Year A U.S. Corporate and Yankees |
80 |
65 |
-15 |
|
1-3 Year BBB U.S. Corporate and Yankees |
109 |
97 |
-12 |
|
0-3 Year AAA U.S. Fixed-Rate ABS |
70 |
69 |
-1 |
Option-Adjusted Spread (OAS) measures the spread of a fixed-income instrument against the risk-free rate of return. U.S. Treasury securities generally represent the risk-free rate.
Falling yields and improved optimism for an economic soft landing bolstered risk assets in general and credit spreads specifically. Spreads on lower-rated issuers outperformed as their perceived greater vulnerability to a potential recession and to refinancing risk eased. Countering the trend, AAA-rated asset-backed securities (ABS) spreads were virtually unchanged in the quarter, likely due to deterioration in consumer debt performance for sub-prime and lower income borrowers. AAA ABS spreads ended the year slightly higher than single-A U.S. corporate debt.
Credit Sector Relative Performance of ICE BofA Indexes
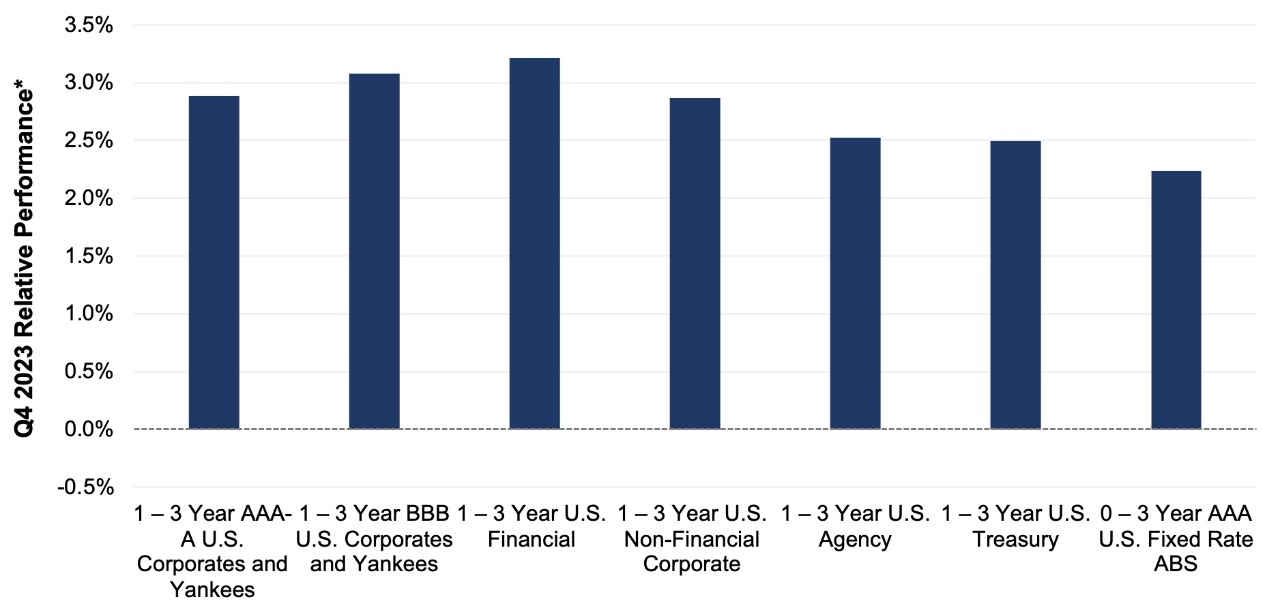
ICE BofA Index
*AAA-A Corporate index outperformed the Treasury index by 39.1 bps.
*AAA-A Corporate index underperformed the BBB Corporate index by 19.3 bps
*U.S. Financials outperformed U.S. Non-Financials by 35.0 bps
U.S. financials continued to outperform non-financial corporate debt as concerns over U.S. regional banks and overall bank funding waned. Further, the fall in yield curve levels likely improved unrealized loss positions on bank balance sheet securities.
What were the major factors influencing money market funds this quarter?
The fourth quarter of 2023 concluded with the FOMC on hold and the market taking on a dovish tone. The Fed left rates unchanged at a range of 5.25% to 5.50% at the December 13 meeting and signaled the end of the rate hike cycle. The committee’s commentary, perceived as dovish, left federal fund futures anticipating approximately 150 bps in rate cuts for 2024. There are a wide range of opinions on the path of future rate activity, and the challenge for managers going forward is determining how the economy and inflation will influence Fed fund policy.
Money market fund assets continued to increase during the quarter as elevated money market yields attracted investors. With the Fed focused on price stability, money market funds remain an attractive investment option for fixed income investors.
First American Prime Obligations Funds
Credit conditions and trading ranges appear stable given the current rate and geopolitical environment. Considering the yield curve and a conservative cash flow approach, the First American Funds were positioned with strong portfolio liquidity metrics influenced by Fund shareholder makeup. We continued to employ a heightened credit outlook, maintaining positions presenting minimal credit risk to the Fund’s investors. During the fourth quarter, our main investment objective was to maintain liquidity while opportunistically enhancing portfolio yield based on our economic, credit and interest rate outlook, along with considerations of investor cash flows. We believe the credit environment and higher relative fund yields make the sector an appropriate short-term option for investors.
First American Government and Treasury Funds
Treasury bill/Note supply continued to expand as the Fed continued QT and overall debt needs accelerated. Increased bill supply created some front-end pricing pressures, which presented beneficial investment opportunities for Fund shareholders. With the Fed on hold and their next move most likely a downward move in rates, managers extended durations, investing in longer-term securities to get ahead of a forecasted lower yield environment. When presented with appropriate value, we also purchased floating-rate investments designed to benefit shareholders over the securities holding period. Our investment strategy will be fluid in the coming quarters as markets make determinations on the Fed’s comfort level with inflation and ultimately the timing and pace of future rate moves.
First American Retail Tax Free Obligations Fund
Municipal variable rate demand note (VRDN) resets remained volatile in Q4. Large weekly rate adjustments of 50 bps or more were required at times to bring supply and demand factors into better balance. These sharp moves in the Securities Industry and Financial Markets Association (SIFMA) Municipal Swap Index (a measure of 7-day, tax-exempt variable rate demand notes) have been commonplace throughout 2023. Somewhat new this quarter was increased demand for one-year municipal notes. Yields for these securities fell by approximately 70 bps, as investors sought income protection versus potential Fed rate cuts in 2024. Our current strategy is focused on increasing allocations to fixed rate investments and extending the Fund’s weighted average maturity.
What near-term considerations will affect fund management?
Industry-wide, we believe prime fund yields have probably peaked and will gradually fall as managers roll maturities into flat to lower yields that are pricing in the possibility of future rate cuts. We believe front-end yields in credit securities will continue to benefit from the overall supply increase in Treasury securities, as there will be competition among issuers for the marginal dollar. Based on our market outlook and breakeven analysis, we will seek to capitalize on investment opportunities that make economic sense. The Institutional and Retail Prime Obligations Funds should remain reasonable short-term investment options for investors seeking higher yields on cash positions while assuming minimal credit risk.
Yields in the government-sponsored enterprise (GSE) and Treasury space will remain influenced by Fed policy and Treasury bill/note supply. With front-end yields elevated and the Fed still wary of inflation, we expect the investment environment for government money market funds to remain attractive. As with non-government debt, Government and Treasury fund yields have probably peaked and will gradually decline as managers roll maturities into flat to lower yields that are pricing in the possibility of future rate reductions. We anticipate some yield dislocations in Treasury and GSE issues as the influx of bill supply and continued QT increase competition as bonds look for a home away from dealer balance sheets. Any large supply changes in Treasury issuance may create yield volatility on the front end as the forces of supply and demand seek optimization. Investors may also decide to opportunistically invest in term securities, extending durations, as markets attempt to solve the timing and pace of future Fed policy. We will continue to seek value in all asset classes and exploit market conditions that support domestic and global economic outlooks.
For more information about the portfolio holdings, please visit
https://www.firstamericanfunds.com/index/FundPerformance/PortfolioHoldings.html
Sources
Bloomberg
https://www.wsj.com/politics/policy/congressional-negotiators-reach-agreement-on-1-6-trillion-government-spending-level-for-2024-c593a1b5?mod=policy_news_article_pos3
https://www.federalreserve.gov/monetarypolicy/files/fomcprojtabl20231213.pdf
https://www.federalreserve.gov/monetarypolicy/files/monetary20231213a1.pdf
https://www.federalreserve.gov/monetarypolicy/files/monetary20231101a1.pdf

Jim Palmer, CFA

Jeff Plotnik

Mike Welle, CFA